The DWARF debugging Format
Requirements
For this article we will be using a few different programs to do some tests on the debugging format.
To replicate the examples in this article you need:
gccorclang- a nice and simple C program
readelfandobjdump
During this article we will be using gcc and clang to compare and do a few experiments.
To generate debugging information, you can use the -gdwarf flag in the two compilers to get an ELF file with the right DWARF debugging info in it.
I recommend also using -O0 to avoid any problems with optimized out sections of code.
Introduction
Debugging is a crucial aspect of software development, especially in low-level systems programming where visibility into code execution is limited. When software is compiled, the original source code is transformed into binary machine code, which is difficult to interpret without specialized tools.
Debugging formats bridge this gap by providing a way to map the binary instructions back to the original source code, making it possible to track variables, breakpoints, and execution flow. One of the most widely used debugging formats today is DWARF, which we’ll explore in depth.
Before diving into DWARF, it’s important to understand the landscape of debugging formats and why DWARF became a standard in many systems.
Why do we need DWARF ?
Debugging compiled programs is inherently complex due to the transformation of human-readable source code into machine code, which lacks any obvious references to original variables, functions, or line numbers.
Debugging formats are designed to restore this visibility by embedding metadata that tools like debuggers can use to interpret the execution of a binary in relation to its source.
Over the years, multiple debugging formats have been developed, each tailored to specific operating systems, architectures, or compilers.
Among these, DWARF stands out for its flexibility, wide support across platforms, and detailed information that aids in debugging tasks like stack tracing and symbolic debugging.
But DWARF wasn’t the first attempt to solve this problem. To understand why DWARF became prominent, we need to look at the other debugging formats that came before or were used alongside it.
A brief history of debugging formats
Throughout the evolution of software development, several debugging formats have been used. Here’s a quick look at some key formats:
-
Stabs:
One of the earliest debugging formats, Stabs (Symbol Table Strings) originated in Unix systems. Initially simple, it grew into a complex and inconsistent format with many undocumented extensions by Sun Microsystems and GCC.
Despite its complexity, Stabs is still used in some systems due to its historical prevalence.
-
COFF:
The Common Object File Format (COFF) was created for Unix System V. It contained little built-in debugging information but allowed other formats, like Stabs, to be embedded within it.
However, COFF’s structure varied significantly across different hardware architectures, which led to non-standardized extensions (e.g., XCOFF for IBM and ECOFF for MIPS/ALPHA), making it hard to maintain and document across platforms.
-
IEEE-695:
Proposed as a standard by IEEE in 1990, this format aimed to be a flexible solution that could be used across various architectures. However, it saw limited adoption due to the rise of proprietary extensions that weren’t incorporated into the official standard.
Enter DWARF
DWARF (Debugging With Arbitrary Record Formats) was developed to address the limitations of earlier debugging formats. It’s name comes from the ELF format that it uses extensively and does not have a very deep meaning and was supposed to be a pun.
The first version, DWARF 1, was bulky and difficult to use, particularly in embedded systems.
However, later versions (beginning with DWARF 2) significantly improved its usability by reducing its size and complexity. DWARF 2 and its subsequent iterations have since become the standard in many Unix-like systems, including Linux, and are widely supported by compilers like GCC and LLVM.
DWARF’s strength lies in its detailed and standardized way of encoding debugging information, making it useful across different architectures and toolchains. The format provides information on variable types, function definitions, source code locations, and even complex data like call stacks for debugging across optimized code.
In the following sections, we’ll explore how DWARF is structured, how it maps executable code back to source code, and how debuggers use this information to trace program execution.
Some basics about ELF, sections and compiler terminology
Compiler terminology
To start we will introduce a few concepts that will be usefull to the comprehension of this article.
Compilation Units often abbreviated as CU are a basic unit of compilation in C. It consists of a single source file plus the content of any header files directly (or not) include. It can be compiled in a single object file, library of executable program.
In compiler terminology we will often speak of the location of an expression, this is a very basic concept that basically means position in program ie the source file, the line number and the column.
What is an ELF
ELF (Executable Linkable Format) is a file format for executable files, object code, shared libraries and core dumps.
Each ELF file is made of one ELF header and file data. The data generally includes a program header, a section header table and Data reffered to by entires in the program header table
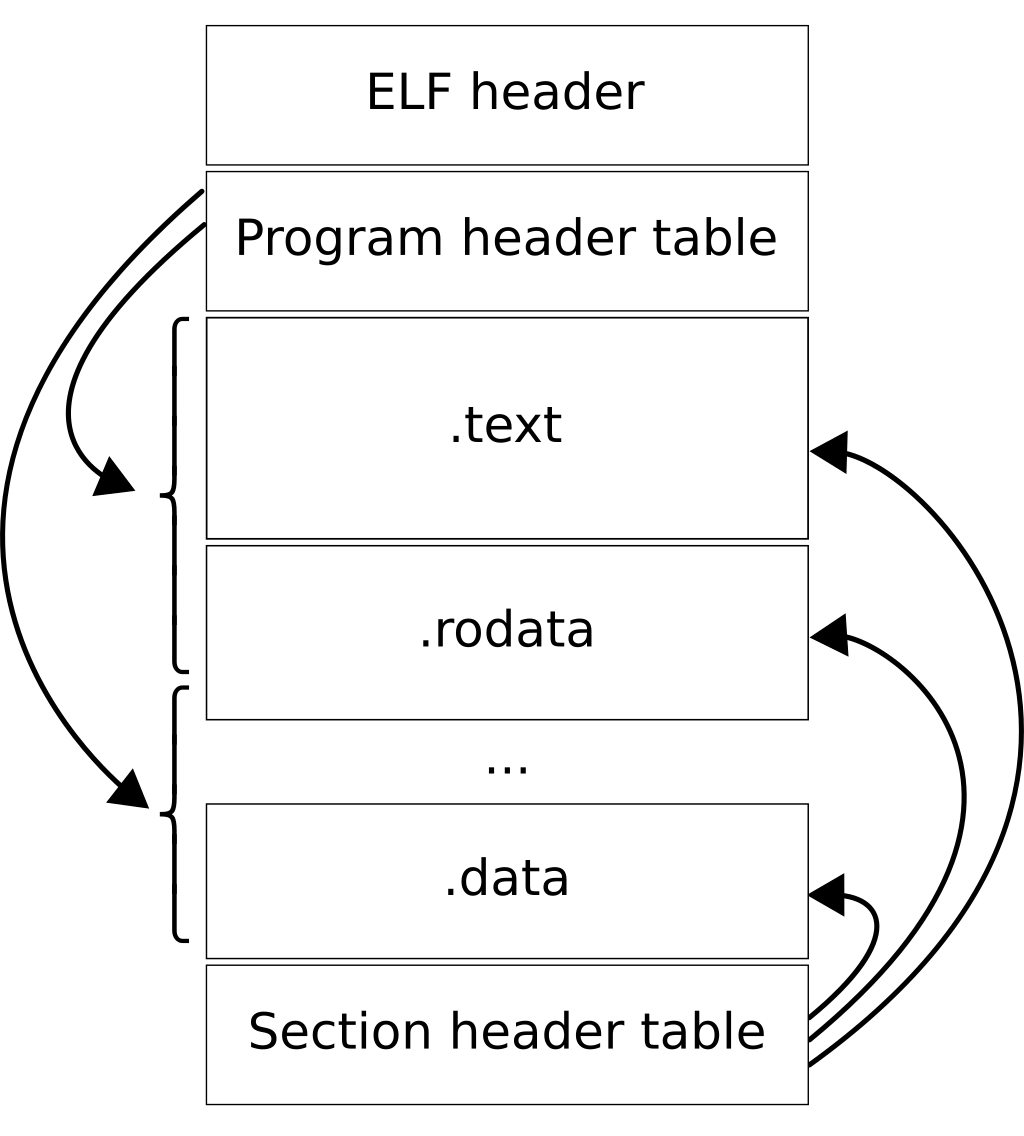
Sections are where our debug data is stored so if you want more information on ELF structure you can read this series of articles that go in depth on the format.
The DWARF Format
We will now go in depth on how the DWARF format is structured and generated, more precisely DWARF is structured in different sections stored inside the ELF. Here is a brief overview of the different sections that we will look into in this article :
.debug_lineMaps memory addresses to line numbers.debug_infoType, variable and function information.debug_frameor.eh_frameUnwinding information by memory address.
For this section we will be using the following C program to showcase most features we can while still being readable.
|
|
The different sections, what they contain and the global structure
Location information
The .debug_line section contains a sequence of operations that are executed by a state machine to form a giant matrix.
For example on our small C program we can get the raw content of the section by doing readelf -wl ./a.out This generates a lot of text so we will focus on the more relevant parts.
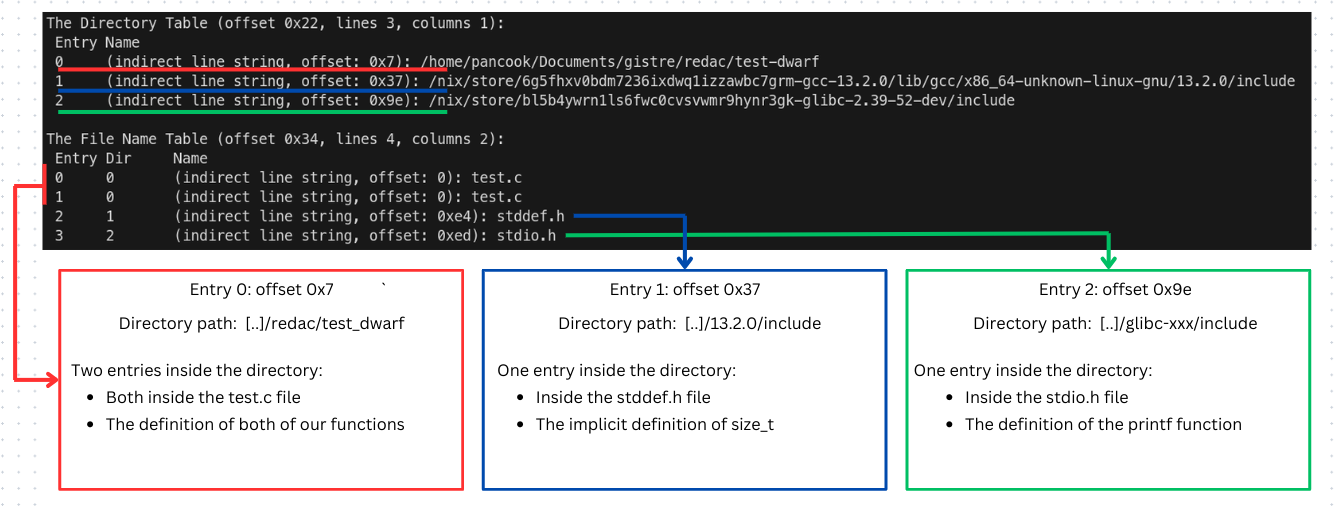
The Directory table binds a specific directory ID (used internally by DWARF) with it’s source path. In combination with the File Name table it is used by the debugger to have a precise idea of where every object’s source is located in the file system.
Each directory can contain several entries that can be in multiple files.
This is the general file structure described used by our debuggers, and here is a diagram of the output with some context added.
And finally we have the actual Line Number Statements, this table binds each address in a program to a certain location (ie filename, line number, column number).
For example:
  [0x00000048]  Set column to 26
  [0x0000004a]  Extended opcode 2: set Address to 0x401126
  [0x00000055]  Special opcode 7: advance Address by 0 to 0x401126 and Line by 2 to 3
  [0x00000056]  Set column to 3
  [0x00000058]  Special opcode 145: advance Address by 10 to 0x401130 and Line by 0 to 3
  [0x00000059]  Set column to 42
  [0x0000005b]  Special opcode 145: advance Address by 10 to 0x40113a and Line by 0 to 3
  [0x0000005c]  Set column to 12
  [0x0000005e]  Special opcode 35: advance Address by 2 to 0x40113c and Line by 2 to 5
  [0x0000005f]  Set column to 10
  [0x00000061]  Special opcode 118: advance Address by 8 to 0x401144 and Line by 1 to 6
  [0x00000062]  Set column to 12
  [0x00000064]  Special opcode 118: advance Address by 8 to 0x40114c and Line by 1 to 7
  [0x00000065]  Set column to 3
  [0x00000067]  Special opcode 103: advance Address by 7 to 0x401153 and Line by 0 to 7
  [0x00000068]  Set column to 14
  [0x0000006a]  Special opcode 34: advance Address by 2 to 0x401155 and Line by 1 to 8
  [0x0000006b]  Set column to 11
This describes the following table, with the location format being {Filename}:{line number}:{column number}
| Address | Location |
|---|---|
| 0x401126 | test.c:3:26 |
| 0x40113c | test.c:5:12 |
| 0x401144 | test.c:6:10 |
| 0x40114c | test.c:7:12 |
| 0x401155 | test.c:8:11 |
A cleaner representation of this table can be viewed by running readelf -wL ./a.out that will let readelf do all the heavy lifting of parsing all the data and cross-reference all the matrixes to make a more readable output.
Call frame information
Next in our list we have the .debug_frame or .eh_frame sections that work on the same basic principle as .debug_line.
These define a big matrix that contains a sequence of operations that are executed by the state machine to generate register states.
This is used for stack unwinding (which is the process used to produce stack traces) during exceptions or when debugging, we will see FDE’s (Frame Description Entries) and CIE’s (Common Information Entries) used internally by our debuggers.
Like for the debug line section readelf is very handy and has an option to display the decoded register states with readelf -wF ./a.out and we get:
Contents of the .eh_frame section:

00000000 0000000000000014 00000000 CIE "zR" cf=1 df=-8 ra=16
   LOC           CFA      ra
0000000000000000 rsp+8    c-8
          .
          .
          .
00000088 000000000000001c 0000008c FDE cie=00000000 pc=000000000040113c..0000000000401195
   LOC           CFA      rbp   ra
000000000040113c rsp+8    u     c-8
000000000040113d rsp+16   c-16  c-8
0000000000401140 rbp+16   c-16  c-8
0000000000401194 rsp+8    c-16  c-8
A way more readable output that we shortened for readability’s sake, now let’s decompose the last section of the output and try to make sense of it.
First we have the first line that is divided in several components:
00000088 000000000000001c 0000008c FDE cie=00000000 pc=000000000040113c..0000000000401195
These are used by the debugger to be able to have sufficient context for stack unwinding and miscellanous information about offsets and metadata.
After that we have the following data this is the actual call frame information:
   LOC           CFA      rbp   ra
000000000040113c rsp+8    u     c-8
000000000040113d rsp+16   c-16  c-8
0000000000401140 rbp+16   c-16  c-8
0000000000401194 rsp+8    c-16  c-8
Here we have different columns: LOC is the address of PC, and on the same line we have data that can be used to restore the CFA (Call Frame Address) and different registers like rbp or the return address ra in the event that you would unwind the stack at this specific PC, more on that in this article.
Now that we have seen two of the more dense sections of our debugging information let’s talk a bit about the general organisation of all these sections before going in the actual meat of the DWARF format.
There are a lot of other sections that add context for the debugger or are too niche for us to explore in this article so i will briefly mention them for glory and the sake of exhaustivity:
.debug_abbrevabbreviations used in the.debug_info section.debug_arrangesA mapping between memory address and compilation.debug_locLocation description.debug_macinfoMacro descriptions.debug_pubnamesLookup table for global types.debug_rangesaddress ranges referenced by DIEs (More on that in the next section).debug_strString table used by.debug_info
Of course, you can look at all of these sections separately using readelf -w.
DIE (Debugging information Entry)
We will now go in depth on the structure of DWARF’s DIEs, they are stored inside the .debug_info section of out ELF and specify how the program is structured it includes type, variable and other structural information.
How a DIE is structured
A DIE has a tag, which specifies what the DIE describes and a list of attributes which fill in details and further describes the entity. Each DIE (except for the topmost) is contained in or owned by a parent DIE and may have sibling DIEs or children DIEs.
Attributes may contain a variety of values: constants (such as function names), variables (such as the start address for a function) or references to another DIE (such as the type for a function’s return value).
For example here is the tree-like structure of our main function as seen by DWARF.
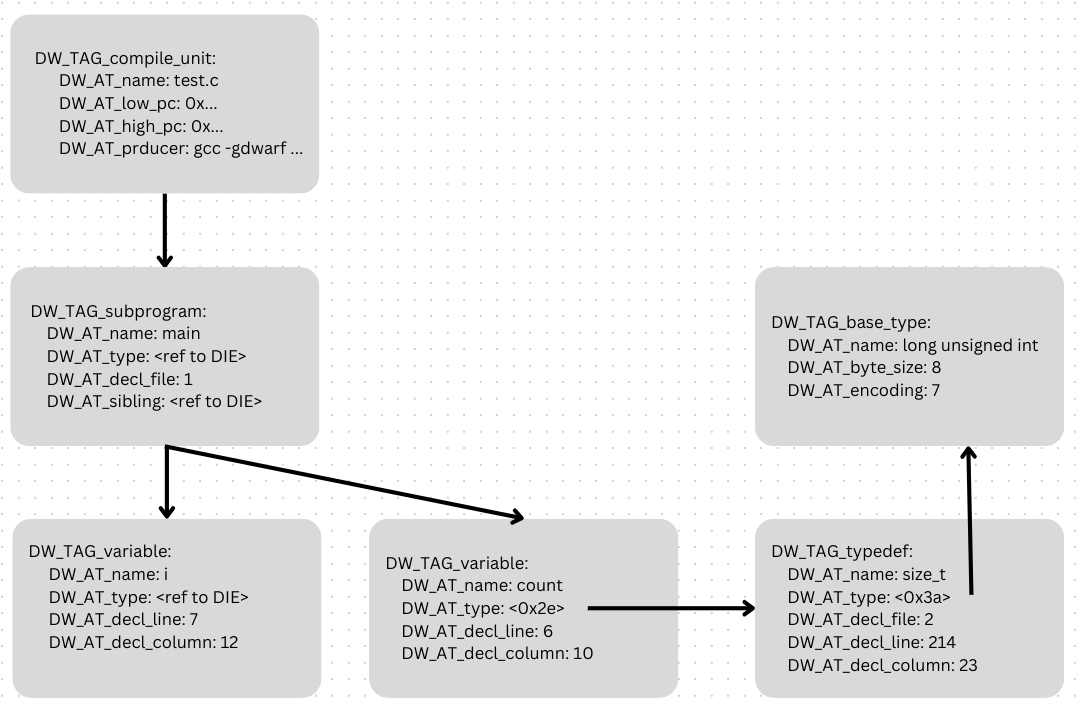
The root DIE here is our compile_unit it defines a name for this CU, a range of program counter it uses and some information about the compiler used to generate the binary and which flags were used.
We can look at the actual representation of the data inside the .debug_info section by using our trusty readelf tool by doing readelf -wi ./a.out.
This will output a large amount of data that may be overwhelming so here is a version where we will only reference our main function and one type reference to keep it simple-ish :
Contents of the .debug_info section:

  Compilation Unit @ offset 0:
   Length:        0x11f (32-bit)
   Version:       5
   Unit Type:     DW_UT_compile (1)
   Abbrev Offset: 0
   Pointer Size:  8
 <0><c>: Abbrev Number: 3 (DW_TAG_compile_unit)
    <d>   DW_AT_producer    : (indirect string, offset: 0x3b): GNU C17 13.2.0 -mtune=generic -march=x86-64 -gdwarf -O0
    <11>   DW_AT_language    : 29	(C11)
    <12>   DW_AT_name        : (indirect line string, offset: 0): test.c
    <16>   DW_AT_comp_dir    : (indirect line string, offset: 0x7): /home/pancook/Documents/gistre/redac/test-dwarf
    <1a>   DW_AT_low_pc      : 0x401126
    <22>   DW_AT_high_pc     : 0x6f
    <2a>   DW_AT_stmt_list   : 0
 <1><2e>: Abbrev Number: 4 (DW_TAG_typedef)
    <2f>   DW_AT_name        : (indirect string, offset: 0): size_t
    <33>   DW_AT_decl_file   : 2
    <34>   DW_AT_decl_line   : 214
    <35>   DW_AT_decl_column : 23
    <36>   DW_AT_type        : <0x3a>
  <1><3a>: Abbrev Number: 1 (DW_TAG_base_type)
    <3b>   DW_AT_byte_size   : 8
    <3c>   DW_AT_encoding    : 7	(unsigned)
    <3d>   DW_AT_name        : (indirect string, offset: 0x7): long unsigned int
               .
               .
               .
 <1><9c>: Abbrev Number: 11 (DW_TAG_subprogram)
    <9d>   DW_AT_external    : 1
    <9d>   DW_AT_name        : (indirect string, offset: 0x27): main
    <a1>   DW_AT_decl_file   : 1
    <a2>   DW_AT_decl_line   : 5
    <a3>   DW_AT_decl_column : 5
    <a4>   DW_AT_type        : <0x64>
    <a8>   DW_AT_low_pc      : 0x40113c
    <b0>   DW_AT_high_pc     : 0x59
    <b8>   DW_AT_frame_base  : 1 byte block: 9c 	(DW_OP_call_frame_cfa)
    <ba>   DW_AT_call_all_tail_calls: 1
    <ba>   DW_AT_sibling     : <0xed>
 <2><be>: Abbrev Number: 12 (DW_TAG_variable)
    <bf>   DW_AT_name        : (indirect string, offset: 0x2c): count
    <c3>   DW_AT_decl_file   : 1
    <c4>   DW_AT_decl_line   : 6
    <c5>   DW_AT_decl_column : 10
    <c6>   DW_AT_type        : <0x2e>
    <ca>   DW_AT_location    : 2 byte block: 91 68 	(DW_OP_fbreg: -24)
 <2><cd>: Abbrev Number: 13 (DW_TAG_lexical_block)
    <ce>   DW_AT_low_pc      : 0x40114c
    <d6>   DW_AT_high_pc     : 0x2c
 <3><de>: Abbrev Number: 14 (DW_TAG_variable)
    <df>   DW_AT_name        : i
    <e1>   DW_AT_decl_file   : 1
    <e2>   DW_AT_decl_line   : 7
    <e3>   DW_AT_decl_column : 12
    <e4>   DW_AT_type        : <0x64>
    <e8>   DW_AT_location    : 2 byte block: 91 64 	(DW_OP_fbreg: -28)
Type DIEs
Every programming language defines several basic scalar types, for example both Java and C define int and double but Java provides a complete definition of these types while C specifies some general characteristics and lets the compiler choose the details depending on the target architecture.
While some other languages allow for new base types to be defined and letting the compiler choose the implementation.
DWARF base types provide the lowest level mapping between simple data types and how they are implemented on the machine’s hardware, this makes the definition of int explicit for C and Java.
For example on a typical 32-bits processor the base type int is defined as:
DW_TAG_base_type:
       DW_AT_byte_size   : 4
       DW_AT_encoding    : 5	(signed)
       DW_AT_name        : int
Where the attributes specify a name, (int), an encoding (signed binary integer) and the size in bytes (4).
DWARF uses base types to construct other types definitions by composing it, this enables DWARF to describe every type in a quite simple manner for example the type of const char **argv looks like:
<1>: DW_TAG_variable
        DW_AT_name = argv
        DW_AT_type = <2>

<2>: DW_TAG_pointer_type
        DW_AT_byte_size = 4
        DW_AT_type = <3>

<3>: DW_TAG_pointer_type
        DW_AT_byte_size = 4
        DW_AT_type = <4>

<4>: DW_TAG_const_type
        DW_AT_type = <5>

<5>: DW_TAG_base_type
        DW_AT_name = char
        DW_AT_byte_size = 1
        DW_AT_encoding = unsigned
Variable DIEs
Variable are generally very simple objects, they have a name which represents a chunk of memory that can contain some kind of value which has a type and constraints (like const).
The complexity of variable can come from scope handling, but we will not go over how it is handled, a basic variable is simply defined in DWARF as:
DW_TAG_variable:
       DW_AT_name        : count
       DW_AT_decl_file   : 1
       DW_AT_decl_line   : 6
       DW_AT_decl_column : 10
       DW_AT_type        : <0x2e>
       DW_AT_location    : 2 byte block: 91 68 	(DW_OP_fbreg: -24)
Functions and subprogram DIEs
DWARF treats functions that return values and subroutines that don’t as the same thing and describes them as subprogram DIEs they look like this:
DW_TAG_subprogram
       DW_AT_external    : 1
       DW_AT_name        : main
       DW_AT_decl_file   : 1
       DW_AT_decl_line   : 5
       DW_AT_decl_column : 5
       DW_AT_type        : <0x64>
       DW_AT_low_pc      : 0x40113c
       DW_AT_high_pc     : 0x59
       DW_AT_frame_base  : 1 byte block: 9c 	(DW_OP_call_frame_cfa)
       DW_AT_sibling     : <0xed>
These DIEs have a name, source location and an attribute which indicates whether the subprogram is external, that is visible outside the current CU. It also has attributes that give the low and high memory addresses that the program occupies, if it is contiguous, or a list of memory ranges otherwise.
The return value of a function is given by the type attribute, subroutines that do not return values do not have this attribute. The sibling attribute is meant to point to other subprograms defined in a given scope.
Conclusion
The DWARF debugging format provides a robust and detailed framework for debugging information, making it a crucial tool for understanding compiled programs at a low level.
Through sections like .debug_info, .debug_line, and .debug_frame, DWARF encodes everything from source code locations to complex data structures and stack unwinding information.
Its core unit, the Debugging Information Entry (DIE), encapsulates the structure of programs, from variables to types, enabling debuggers to map high-level code to machine instructions.
As we’ve seen through practical examples using tools like readelf and objdump, DWARF organizes vast amounts of information in a highly structured format.
While sections like .debug_line facilitate mapping addresses to source lines, sections like .debug_frame and .eh_frame aid in stack unwinding during debugging.
DIEs provide a hierarchical, tree-like representation of a program, allowing for precise handling of complex structures such as functions, variables, and types.
This article has merely scratched the surface of DWARF, if you want to go a bit deeper you can try to see how macros and high level structured defined in languages such as C++ / Rust / Java are handled by DWARF. If for some reason you want to look at how compilers generate this kind of data you can look at LLVM’s documentation which goes a bit more in depth on how it works in their backend.
Bibliography
Introduction to the DWARF format
implementation of a fully working DWARF parser
Specification of the ELF format